European economic production and consumption have become less waste intensive, even after the economic downturn since 2008 is considered in the analysis.
From the production side, waste generation from manufacturing in the EU-28 and Norway declined by 25% in absolute terms between 2004 and 2012, despite an increase of 7% in sectoral economic output. Waste generation by the service sector declined by 23% in the same period, despite an increase of 13% in sectoral economic output.
Turning to consumption, total municipal waste generation in EEA countries declined by 2% between 2004 and 2012, despite a 7% increase in real household expenditure.
One of the objectives in EU waste policy is to reduce waste generation in absolute terms, within the overall goal to decouple economic growth from resource use and environmental impacts. Waste prevention efforts across Europe seems to contribute to the waste objectives; with considerable differences between the countries. Wider analysis across different economic sectors within and beyond EU borders will be needed in order to provide more comprehensive conclusions.
Waste generation by production and consumption activities
The waste hierarchy, the guiding framework in EU and national waste policies, gives the highest priority to waste prevention, followed by (preparing for) re-use, recycling, other recovery and disposal. The highest priority to waste prevention is also highlighted by the recent waste and resource efficiency policies and strategies at EU and national levels.
Measuring waste prevention is a complex task. Quantifying waste prevention is difficult since it often amounts to measuring what is not there. For that reason, waste generation related to demographics or economic activity, as well as waste generation as such are considered the closest approximation for measuring quantitative waste prevention.
European economic production and consumption is apparently becoming less waste intensive, even after the economic downturn since 2008 is factored into the analysis. European trend, however, masks differing developments across European countries.
Production activities
In EU-28 and Norway nearly half of the total waste, excluding major mineral wastes, was generated by the manufacturing and services sectors in 2012, while their contribution to the total gross value added (GVA) was predominant.
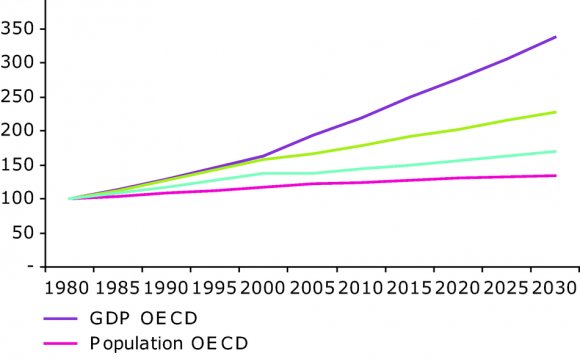
For both sectors, generation of waste declined in spite of increased economic output over the period 2004-2012 (Figure 1). The most notable decline in waste generation was observed in the manufacturing sector with 25% expressed in absolute terms. In the same period its economic output increased by 7%, with the largest increase in the information and communication sector. In the same period, economic output from the services sector increased by 13%, while waste generation declined by 23%, expressed in absolute terms.
It is considered that the services sector is less waste intensive than the manufacturing sector on average. As the waste intensity of the service sector (0.014 kg/EUR in 2012) was lower than for the manufacturing sector (0.12 kg/EUR in 2012), a shift to the services sector in the economy is a contributor to less waste generation.
This improvement might be due to a combination of various factors: efficiency improvements in production processes and management, changes in the structure of the manufacturing sector, increase in activities in services sector and a shift towards less-intensive waste generating activities.
RELATED VIDEO


RELATED FACTS
-
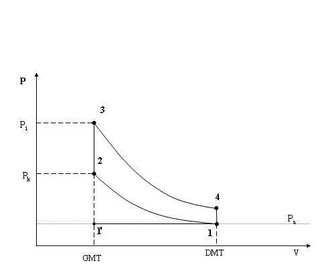 A petrol engine (known as a gasoline engine in North America) is an internal combustion engine with spark-ignition, designed to run on petrol (gasoline) and similar volatile fuels. It was invented in 1876 in Europe.
In most petrol engines, the fuel and air are...
Share this Post
latest post
-
 Waste Management Lafayette Indiana November 14, 2023
 -
 New Zealand Waste Management November 10, 2023
 -
 Waste Management Spokane Valley Waste November 6, 2023
 -
 Waste Management Baltimore November 2, 2023
 -
 Waste Management Fort Wayne October 29, 2023
 -
 Industrial Waste Management October 25, 2023
 -
 Waste Management Macomb IL October 21, 2023
 -
 What is Waste disposal? October 17, 2023
 -
 Waste Management Pittsburgh PA October 13, 2023